Sentiment analysis on twitter data with ELK
In this post we’ll perform a very quick installation of ELK, then get some tweets filtered by a certain keyword and finally add a sentiment analysis plugin into the logstash pipeline.
Prerequisite: you may already be familiar with Docker and Docker Compose.
ELK stands for:
- Elasticsearch: a search engine providing a distributed, multitenant capable full-text search
- Logstash: a service used to collect, process and forward events and log messages
- Kibana: a browser-based analytics and search interface for Elasticsearch
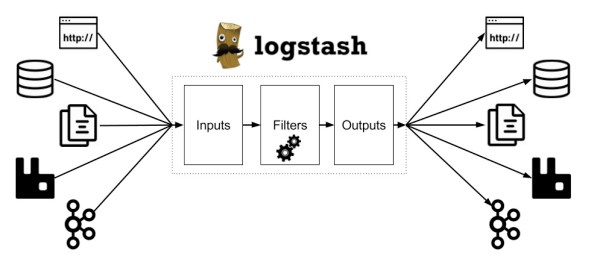
Below, a diagram of the ELK stack.

Setup with Docker
For convenience, we’ll use Docker for the setup. Indeed, the repository docker-elk gives a ready to use Elastic stack (ELK) infrastructure based on Docker and Docker Compose. All the installation process is well defined in the README so we won’t go into more details here.
Twitter logstash plugin
Logstash uses configurable input plugin to retreive data, filters to process it and ouptuts to define where to write all the aggregated data.
Tweets can be collected via the twitter input plugin. Plugins are defined in logstash configuration files. So, retreiving twitter messages based on keyword can be achieved by adding a configuration file:
input {
    twitter {
        consumer_key => "<your_consumer_key>"
        consumer_secret => "<your_consumer_secret>"
        oauth_token => "your_oauth_token"
        oauth_token_secret => "your_oauth_token_secret"
        keywords => [ "Coronavirus", "COVID-19" ]
        languages => [ "en-US" ]
    }
}
For this post, we override the logstash.conf in kibana/logstash/config/logstash.yml.
If you don’t already have a twitter developper account, you may get one by following the twitter documentation.
We added languages property to the twitter configuration to get only twitter message in english. languages take an array of string of bcp-47 language code, see BCP-47 Code List. However, after experimentation it doesn’t seem to filter as expected so it will require further investigations.
Add sentiment analysis filter plugin
Once the input plugin has collected data it can be processed by any number of filters which then modify and annotate the event data.
We use a filter to perform a sentiment analysis on twitter messages. I found this one logstash-filter-sentimentalizer and add it to the logstash Dockerfile
ARG ELK_VERSION

# https://github.com/elastic/logstash-docker
FROM docker.elastic.co/logstash/logstash:${ELK_VERSION}

# Add your logstash plugins setup here
RUN logstash-plugin install logstash-filter-sentimentalizer
After this change you must run
docker-compose build
And then, we add a filter in the logstash configuration file
filter {
  sentimentalizer {
    source => "message"
  }
}
Output to Elasticsearch
Finally logstash routes events to output plugins which can forward the events to a variety of external programs including Elasticsearch, local files and several message bus implementations.
In this post, we simply pass the output to Elacticsearch. So we add the following to the configuration file
output {
    elasticsearch {
        hosts => "elasticsearch:9200"
        user => "elastic"
        password => "changeme"
        index => "twitter"
        document_type => "tweet"
    }
    stdout {codec => rubydebug }
}
Here I let the default login/password from docker-elk which might not be a good practice.
Final configuration file
The configuration file might look like
input {
    twitter {
        consumer_key => "<your_consumer_key>"
        consumer_secret => "<your_consumer_secret>"
        oauth_token => "your_oauth_token"
        oauth_token_secret => "your_oauth_token_secret"
        keywords => [ "Coronavirus", "COVID-19" ]
        languages => [ "en-US" ]
    }
}
filter {
  sentimentalizer {
    source => "message"
  }
}
output {
    elasticsearch {
        hosts => "elasticsearch:9200"
        user => "elastic"
        password => "changeme"
        index => "twitter"
        document_type => "tweet"
    }
    stdout {codec => rubydebug }
}
Visualisation with Kibana
We can now access Kibana interface to get some insights.
First we need to add the twitter index pattern by clicking on “Created index pattern” and writting twitter (defined in the output).
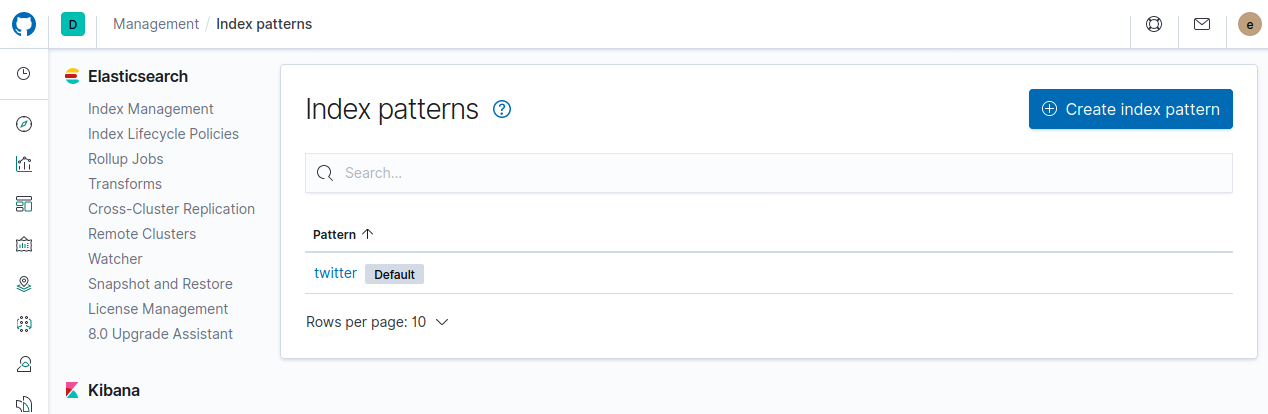
Then we can add some visualization chart by clicking on “Create visualization”
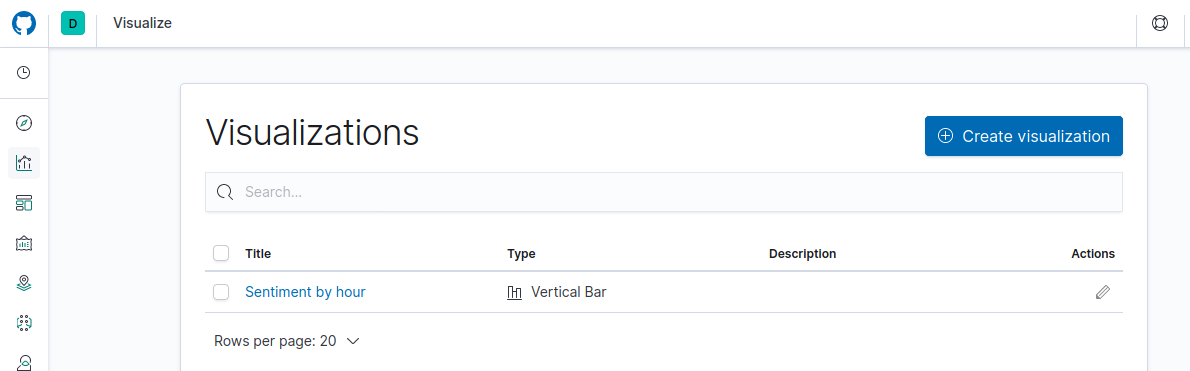
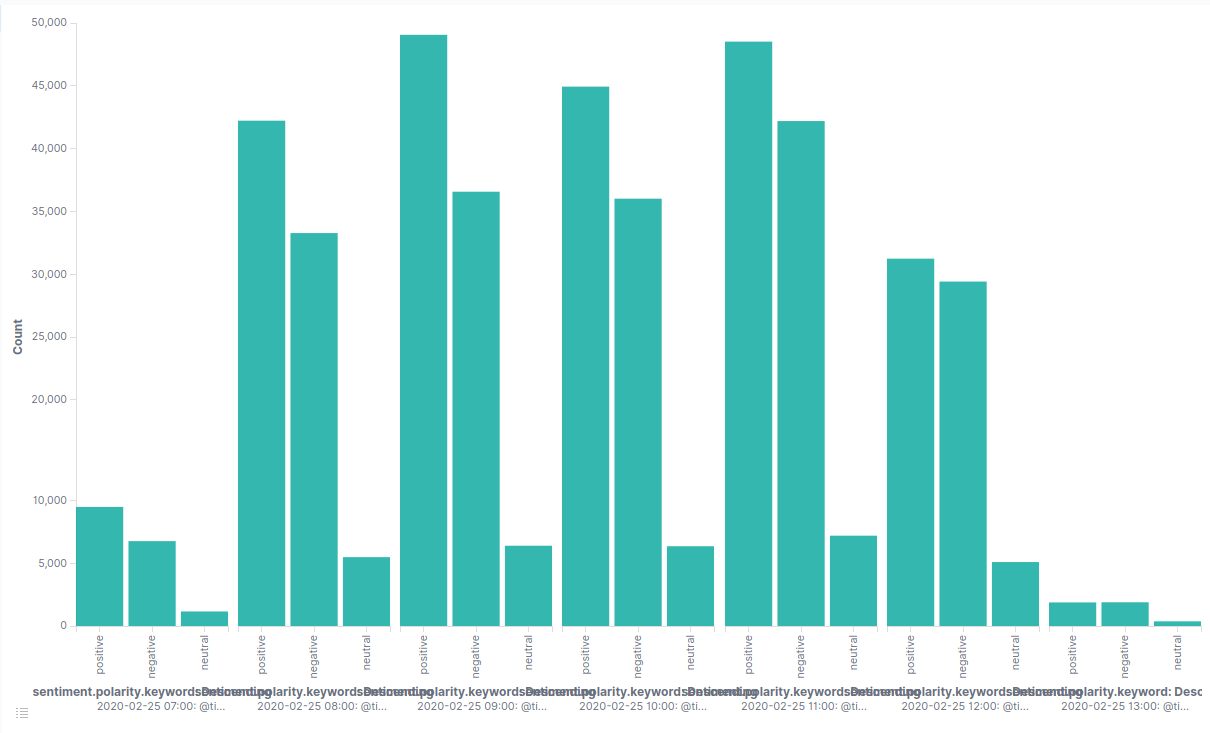
Barchart
In the following barchart we can see the evolution of the sentiment on the keyword “Coronavirus” by hour.
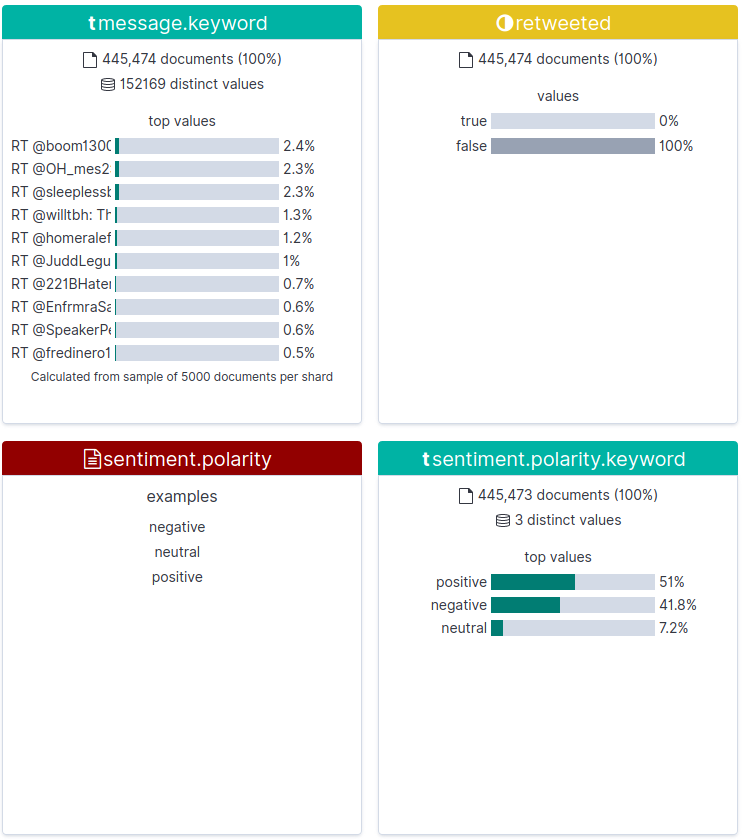
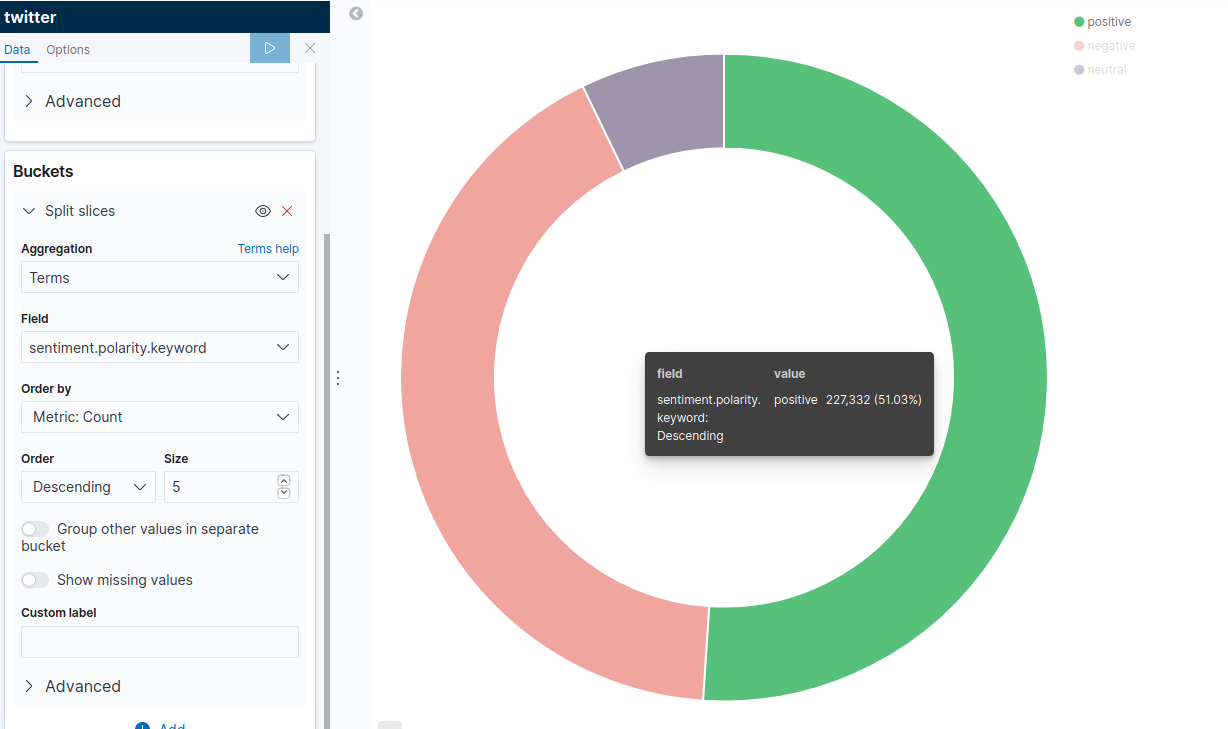
Piechart
An overall view of sentiment polarity on the same keyword
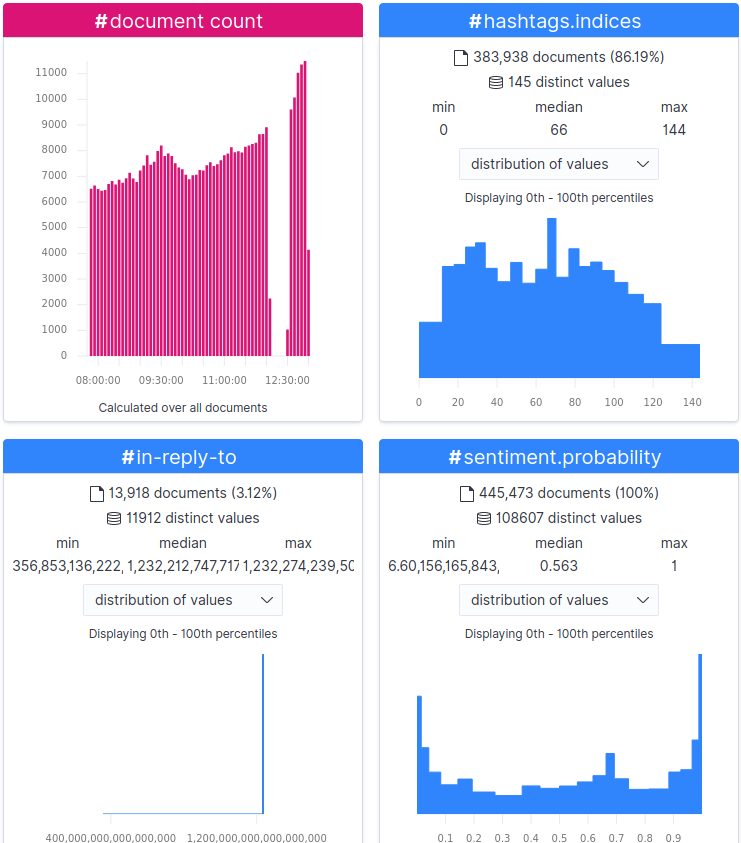
Using data visualizer
We can also have a quick insight of the data by using “Data Visualizer”. We are some screenshots of the indicators we have