Analyzing the correlation between chocolate consumption and cognitive functions

When I was studying at the university, I once made an english report on how to rethink the strategy of a sinking company. By way of this use case, we had to find new game planes for selling, innovate to find new customers and fulfill new customer needs.
The whole exercise was certainly boring, but as I was lurking on the internet in lack of inspiration, I found this note on Chocolate Consumption, Cognitive Function, and Nobel Laureates, by Franz H. Messerli published in the New England Journal of Medecine in 2012. In this paper, the author wanted to test whether chocolate consumption enhance human cognition. Indeed, according to a prior study, rats improved their cognitive performances after the administration of a cocoa polyphenolic.
As a last word of the report, I adviced the fake managing directors to eat more chocolate as to improve their cognitive functions and help them finding disruptive ideas to enhance their business. Sounds like a good idea, isn’t it? (well… maybe not).
Table of contents
- Description of the note
- A little improvement of the statistical evidence
- Contextual considerations
- Statistical considerations
- Retry attempt and conclusion
- Resources
Description of the note
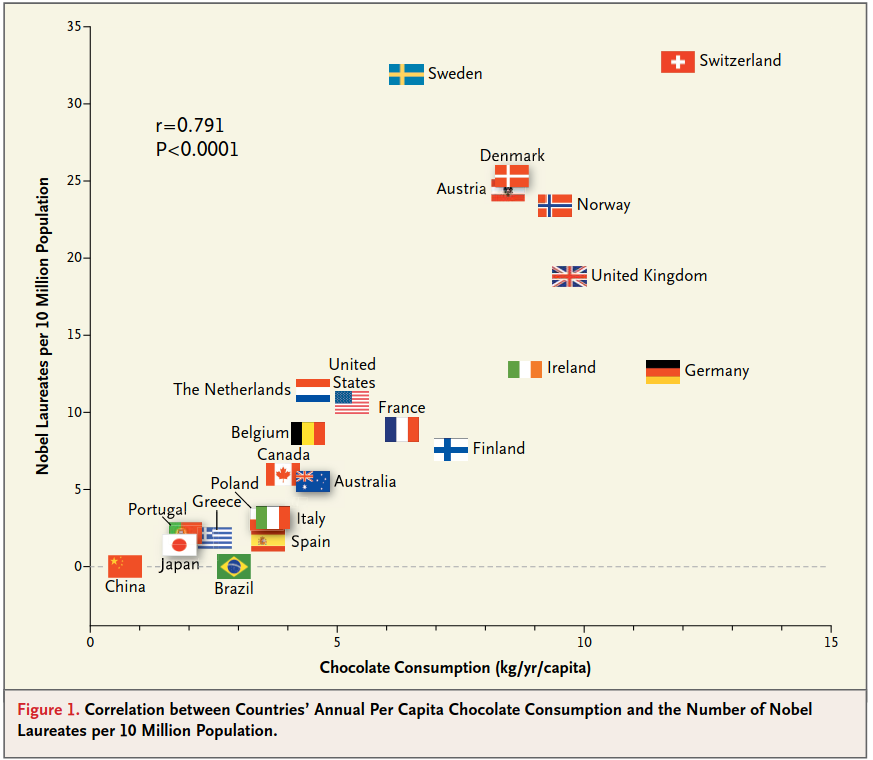
The study was purely observational as no clinical trial was lead. The author maked use of open data. The total number of Nobel laureates per capita were taken as a “surrogate” to cognitive performance. Chocolate consumption estimation came from three different data sources published by chocolate players: chocolate manufacturers, federations and associations.
The hypothesis: chocolate consumption improves cognitive function
The data:
- Per capita Nobel laureates on the last century
- Per capita yearly chocolate consumption of 23 countries
The results:
- Pearson correlation factor \(r = 0.791\)
- Confidence \(\text{p-value} < 0.0001\)
- Null hypothesis: the correlation is equal to 0
- Alternate hypothesis: the correlation is not equal to 0
A correlation coefficient of \(r = 0.791\) indicates a positive and linear correlation between the chocolate consumption and the number of laureates per capita.
The p-value is really low \(p < 0.0001\), which is extremely significant, we are pretty sure that we can reject the null hypothesis, that the correlation is not equal to zero. In other word, it is highly unlikely that the observed correlation is only due to chance.
However proving that the correlation is significantly different than zero doesn’t give that much information about the alternative hypothesis. Why is there a correlation? Which are the reasons causing it? And what is the strength of the correlation? Actually, we could have a similar p-value on a tiny correlation ratio although it would need a larger sample size. (for \(\alpha=0.0001\), and an effect size of 0.1 the sample size needed is 2070) To have a better grasp of the correlation at stake, let’s calculate the confidence interval.
A little improvement of the statistical evidence
Defining the confidence interval at 95%, as the following probability:
\[\text{P}( r \in [r_1, r_2] ) \ge 95%\]In the case of the Pearson’s coefficient, we define the parameter \(z\), that is the Fisher transformation:
\[z(r) = { 1 \over 2 } \ln \left( { 1 + r \over 1 - r } \right) = \text{arctanh} (r)\]\(z\) approximately follows a normal distribution with
- mean \(\bar{z} = \text{arctanh} (r)\),
- standard error \(s_z = { 1 \over \sqrt{n -3}}\)
As \(z\) has a normal distribution, the confidence interval of \(z\) for 95%, \(z_{1 - {\alpha \over 2}} = 2\), is:
\[[ z_1 = \bar{z} - 2 s_z; z_2 = \bar{z} + 2 s_z]\]Then the confidence interval of \(r\) is:
\[r_i = { \exp{(2 z_i)} - 1 \over \exp{(2 z_i)} + 1 }\text{, with } i \in [1, 2]\]Hereafter are the numerical calculation in python (skipping imports for readability):
Finally the confidence interval is:
\[\text{P}( r \in [0.630, 0.887] ) \ge 95%\]The confidence interval doesn’t cross the zero frontier, which is somewhat reassuring against the point of the author, that the chocolate does have a positive effect on human cognition functions. By the way, the author of the study didn’t mention the confidence interval of the correlation coefficient in this note.
If the confidence interval gives us a little more faith in the author’s postulate, there are a tons of other objections that can be made:
- Isn’t the chocolate consumption just an indicator of the wealth of a country? (which is also the case with the “Nobel laureates per capita”)
- Is the set of countries enough to draw conclusions?
- Is “nobel laureates per capita” a direct indicator of the mean cognitive performance of a country?
Contextual considerations
Dark chocolate is not the only factor at play
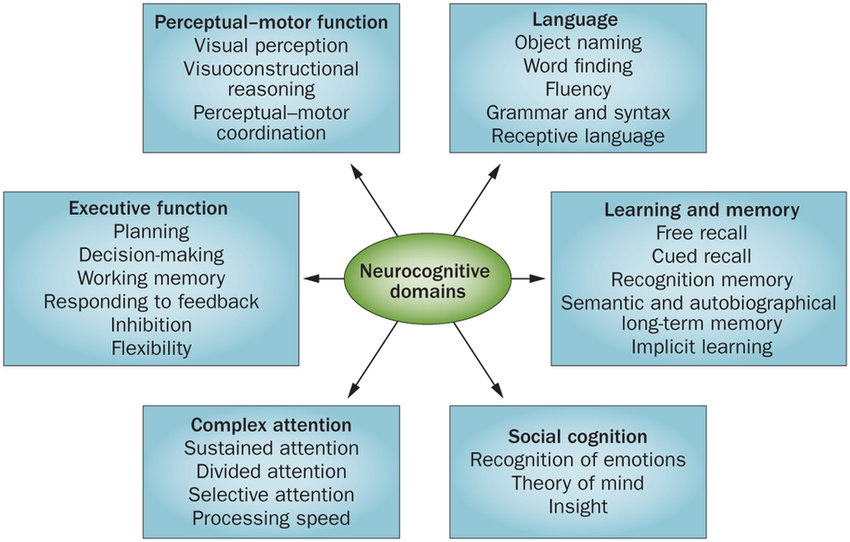
According to the dictionnary, cognition is the “mental action or process of acquiring knowledge and understanding through thought, experience, and the senses”. Cognition is multi-dimensional in the sense that it encompases all aspects of intellectual functions. Wikipedia’s page on cognition lists multiple examples of such intellectual functions: perception, attention, thought, imagination, intelligence, memory, judgment and evaluation, reasoning, problem-solving and decision-making, comprehension and production of language.
The following diagram by Jane S. Paulsen shows some of them grouped by category:
Cognitive function of a human may be influenced by diet, physical activity, sleep, stress levels and intellectual stimulation. All of these factors are dependent at different proportion of the wealth of a person, and by extent to his/her access to learning/cultural resources. The environment in which a person lives inside his/her country, have a significant impact on his/her intellectual/academic achievements. Investment in education, research infrastructure, socioeconomic conditions, and cultural values are predominent.
Who knows in what proportions theses factors influence cognitive functions. Alimentary diet and in a smaller extent the consumption of dark chocolate are only a few among multiples factors that influences cognitive performance of a person.
If the study was experimental, the bio-statistician would have had to design the experiment so that after making a sumup of all the variables having an influence on the system at hand, he/she would:
- find a solution/situation where all these variables are fixed except the two being tested
- make the causing variable change, and observe the joint evolution of the other one
Unfortunately, medical hypothesis testing requires a lot of time and resources. It’s natural trying to get insight with already available indicators beforing choosing to give the go or nogo.
Obviously, these findings are hypothesis-generating only and will have to be tested in a prospective, randomized trial
Note’s author
As a consequence, doing a fair list of the variables influencing the cognitive function before calculating the correlation seems reasonable too. So that the result of the correlation, whatever this value is, can be put in perspective. How the other influencing variables (diet, physical activity, sleep, stress levels) fluctuate in the selected sample of countries and how do they impact the cognitive functions? Who knows…
It’s also worth considering that cocoa is consumed in various forms, ranging from dark chocolate with high cocoa content to milk chocolate with added sugars and fats. The health benefits associated with chocolate are primarily attributed to dark chocolate with higher cocoa content, as it contains a higher concentration of flavonoids and fewer added ingredients. High consumption of chocolate with a low polyphenolic concentration, as well as a low consumption with a high polyphenolic concentration migth weakened the goodness of the indicator. Besides, the average consumption is not necessarily consistent with the laureates’ consumption. By the way, the Flavonoids are not the exclusivity of the dark chocolate, they can also be found in fruits and vegetables, red wine, and teas, among other.
We begin to feel the complexity of the study, and that a “simple” correlation coefficient is probably not a sufficient statistic to give some light on the author’s postulate.
Is Nobel laureates per capita a fair indicator of the cognitive performance of country?
Conceivably, however, the total number of Nobel laureates per capita could serve as a surrogate end point reflecting the proportion with superior cognitive function and thereby give us some measure of the overall cognitive function of a given country.
Note’s author
The Nobel price rewards notable contribution of scientists (accross the globe) in the advance of the knowledge. Rewards span accross the fields of chemistry, literature, peace, physics and medicine. It doesn’t encompass the field of mathematic since Alfred Nobel, the creator of the Nobel’s price, wasn’t really in good terms with mathematicians.
Caution shoud be taken specifically on the Nobel Peace Prize. Indeed, according to the Nobel Peace Center in Oslo, this prize is biaised toward the western countries until the 1990’s: “From the 1990s onwards, many prizes were awarded for human rights, and the peace prize became truly global”. As for the field of mathematic, we could argue that the study is missing the Abel Prize, the Nobel equivalent in the scope of mathematic.
The note presupposed that the number of Nobel laureates per capita is concordant with the average cognitive performance of a country. However a short exploratory analysis of the population of nobel price laureates shows that laureates have around sixty years old or more and that only 6% of laureates are female. Not very representative…
Aren’t there better indicators of the cognitive performance of a country? Well, there surely is. We could take the PISA worldwide ranking as an indicator. The Programme for International Student Assessment is the OECD’s programme which measures 15-year-olds’ ability to use their reading, mathematics and science knowledge and skills to meat real-life challenges.
Geir Lundestad, Secretary of the Norwegian Nobel Committee in 2006, said, “The greatest omission in our 106-year history is undoubtedly that Mahatma Gandhi never received the Nobel Peace prize. Gandhi could do without the Nobel Peace prize, [but] whether Nobel committee can do without Gandhi is the question”
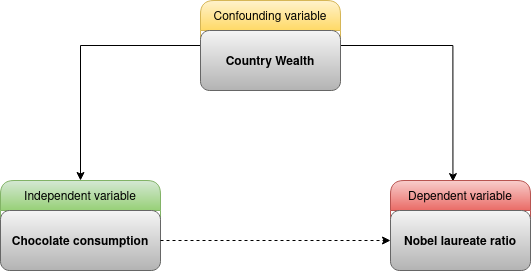
Two indicators (cocoa, cognition) of a confounding variable (country’s wealth)?
Of course, a correlation between X and Y does not prove causation but indicates that either X influences Y, Y influences X, or X and Y are influenced by a common underlying mechanism.
Note’s author
Nonetheless the good starting point of the study, and because the consumption of chocolate and the Nobel laureates per capita are both indicators of the wealth of a (occidental) country, trying to prove that chocolate improve cognition on national statistics, comes to proves that rich countries are actually rich.
The presence of confounding variables can affect the validity of hypothesis testing results, as they can affect the relationship between the variables being tested. The cocoa supposedly have a positive effect on the cognitive function. But isn’t the country wealth strongly impacting both phenomenons and their indicators? The following diagram illustrates this by showing a conceptual model of the variables:
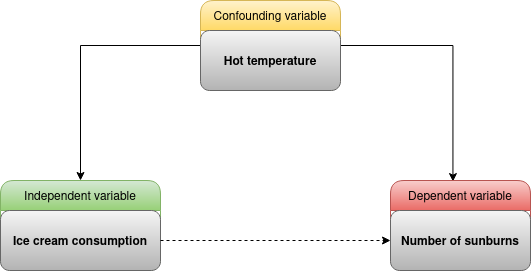
It’s like trying to find a correlation between the garbage indicator and the life expectancy, both are strongly related to the economic state of a country. There is a good chance for them to be correlated. Another good example of the omitted variable bias is the correlation between ice cream consumption and sunburn. There IS a correlation, but does that mean ice cream consumption causes sunburn?
Even if chocolate intake is strongly correlated with cognitive function, it doesn’t mean that an increase in chocolate consumption do enhance cognition. The correlation coeffient says that people eating more chocolate have better chance to have higher cognitive function; it doesn’t say that you’ll enhance your cognitive fonctions by eating more chocolate. Unlike the other study with Wistar-Unilever rats, the current study didn’t intervene on the chocolate consumption of volunteers to see what would happen.
The present data are based on country averages, and the specific chocolate intake of individual Nobel laureates of the past and present remains unknown.
Note’s author
In addition, chocolate is a rather luxury food, it was known by the Mayas as the “Theobroma cacao” (food of the gods). As a non-necessary goods, unlike rice or eggs, inhabitant struggling to find a decent everyday meal may not prioritize chocolate consumption. Even for wealthy inhabitants the local gastronomy has a huge impact on their consumption. For instance, the Chinese middle class doesn’t consume that much of chocolate, unlike red wine, because they simply don’t eat a lot of sweet in general. Last fact but not the least, remember which country invent the compass, the gunpowder, the papermaking and printing? Well, China! And without any chocolate! This fact emphasize the great care to put everythings in an historical perspective. Did you see where China lies on the correlation diagram?
Chocolate consumption is probably an epiphenomenon of the wealth of (occidental) countries, which happen to have an inclination toward sweety foods and therefore are likely to appreciate the Maya beverage. At the same time, the wealthiest countries in the world for the last century (1900-2000) also happen to be in a large majority occidental (be carefull with the Simpson’s paradox!)
It remains to be determined whether the consumption of chocolate is the underlying mechanism for the observed association with improved cognitive function.
Note’s author
Statistical considerations
A very poor sample of wealthy countries
At the level of the statistical evidence, the small selection of countries could be an issue. Indeed, hypothesis testing relies on analyzing sample data to draw conclusions about all the population. The accuracy of the conclusions is influenced by the representativeness and the size of the sample. If the sample of countries is not truly representative of all the countries in the world the results may not be generalizable.
The researcher may have a minimum knowledge of the population parameters. For instance, the chocolate consumption fluctuates from 70 grams to 7000 grams per year per capita between Asian and European countries. With that variability in mind, the researcher usually consider increasing the sample size.
Concerning the degree of accuracy desired, the researcher may consider the acceptable margin of error and the confidence interval for the study. Generally we estimate the number of sample needed for being powered. To calculate the power needed for detecting a correlation coefficient of 0.79, we can use the following equations:
\[H_0: \rho = 0 \\ H_a: \rho = r \ne 0\] \[n = C_{\beta} { 4 \over \left [ \ln { 1 - r \over 1 + r } \right ]^2 } + 3\]- with \(n\), the sample size
- with \(r\), the correlation coefficient that we’d like to detect
- with \(C_{\beta}\) a coefficient dependent on the effect size and beta (type II error)
Thus, with a sample size of \(n=23\) we have almost 99.8% chance of concluding that the correlation coefficient is different than zero when the correlation coefficient is 0.791.
However there are less than 200 countries in the world, in such case, we should look at the sampling ratio. The sampling ratio is the sample size over the population size. Generally speaking, the smaller the population, the larger the sampling ratio needed. For populations under 1000, a common rule of thumb is to have a sampling ratio of 30% at least to ensure representativeness of the sample.
In the case of this study, the sampling is \(23/193 = 11.9\%\). We would rather want to have 58 countries or more in our dataset!
The timespan of the data is heterogenous
This research is evolving, since both the number of Nobel laureates and chocolate consumption are time-dependent variables and change from year to year.
Note’s author
Apart from the constantly evolving number of Nobel laureates and cocoa consumption, the open data used in the study has a huge timespan difference:
- For the Nobel laureates, first awards were given in 1901, so the timespan is 110 years, until the date of the note’s publication
- For the chocolate consumption, the timespan is more chaotic as it comes from multiple sources: chocosuisse, theobroma-cacao and caobisco. The data is gathered on approximately 8 years, from 2004 to 2012.
The calculation of the correlation is done between two phenomenons changing over time and on two very different periods of time: 1901-2012 for the Nobels and 2004-2012 for the chocolate. Without saying it, we consider that the consumption of chocolate didn’t change that much between 1901 and 2004.
Which dependency metric to choose?
The strength of a linear correlation between two continuous variable can be measured by the Pearson correlation coefficient. The relationship is:
- null if \(r=0\)
- perfect if \(r=\mp 1\)
- strong if \(\lvert r \rvert >0.8\)
However a non linear relationship isn’t always measurable by the Pearson correlation, for instance in the case of a parabolic relationship. If the dataset is somewhat linear but contains outliers, the linear relationship may not be detected by the coefficient of Pearson. The famous four graphs of Anscombe illustrate this. They emphasize the variety of datasets that can share the same correlation coefficent of \(r=0.816\):

Numerical calculations are exact, but graphs are rough.
Francis John Anscombe in “Graphs in Statistical Analysis”. American Statistician. 27 (1): 17–21.
So there would be three good reasons to use another famous correlatio metric known as the Spearman coefficient:
- it enables us to measure a correlation between countinous, discrete or ordinal variables
- as the test is non parametric, it takes the ranks instead of the values, so it doesn’t need the data to be normally distributed, and doesn’t need the data to be free of outliers either
- and its’ always nice to be able to compare both corraltion metrics
Retry attempt and conclusion
Giving that the data used by the author of the note is not easily available, it is very hard to reproduce the exact same result. I found some data on wikipedia for the Nobel laureates, and on ourworldindata for chocolate consumption. The whole code for this part is in this notebook.
Hereafter is the scatterplot with the regression line:
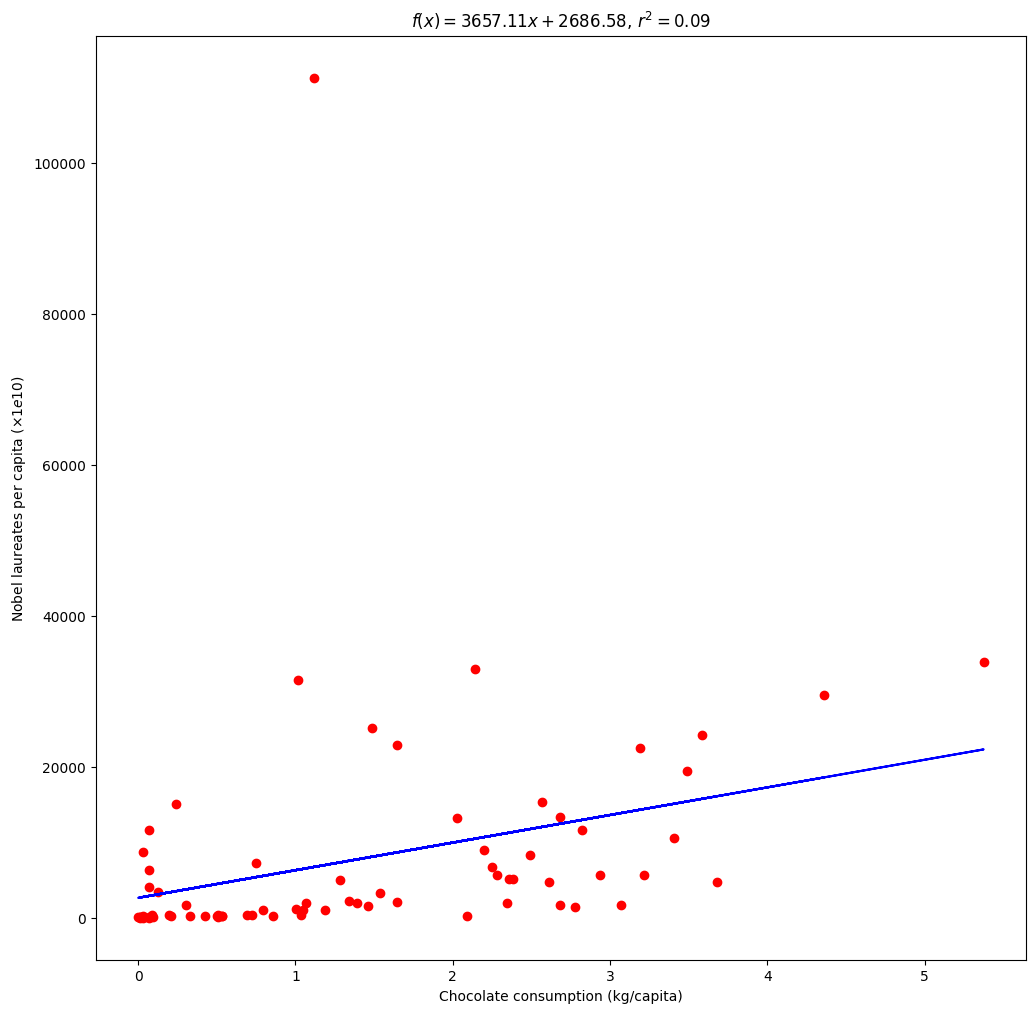
The sample size is 72, so we have a sampling ratio of more than 37%.
| Pearson correlation | Spearman correlation | |
|---|---|---|
| statistic | \(r=0.306\) | \(\rho=0.654\) |
| p-value | \(2.87\text{e-}07\) | \(3.54\text{e-}10\) |
| confidence interval | \(\text{P}( r \in [0.082, 0.500] ) \ge 95%\) | \(\text{P}( r \in [0.499, 0.768] ) \ge 95%\) |
With a lower bound near zero (at 0.082), the strength of the Pearson correlation is way lower than in the note of interest (\(r=0.791\)). Nevertheless, the Spearman coefficient is a lot higher than the Pearson coefficient. It may be an indicator of a nonlinear relashionship and/or a outlier existence. The country of Santa Lucia is clearly an outlier here (at the top of the previous graph).
As the Spearman correlation coefficient give us a little more confidence in the relationship between the two variables, is chocolate really the answer here?
Resources
Cost of foods and chocolate
- Worldwide Food Prices
- Daily cost of a calorie sufficient diet, 2017
- The steep price we pay for cheap chocolate
- La France, 7e au rang des consommateurs de chocolat
Nobel Prices
- Evolution of National Nobel Prize Shares in the 20th Century (by Juergen Schmidhuber)(https://people.idsia.ch/~juergen/nobelshare.pdf)
- Des prix Nobel toujours très masculins et de plus en plus âgés
Cognitive function
Statistics
- La vraisemblance
- Initiation à la statistique bayésienne
- Marginal effect with logistic regression
- Marginal Effects: Definition
- Pearson Correlation Coefficient
- What is a confounding variable?
- Correlation Coefficient using z-transformation
Data Sources
- Nobel Prize - Laureates
- List of countries by Nobel laureates per capita
- Food and Agriculture Organization of the UN
- Cocoa bean consumption per person, 2008
- 31 Current Chocolate Statistics (Market Data 2023)