Age distribution analysis on Coronavirus data
Updated on march 12th 2020
South Korea is testing people for COVID-19 at an impressive rate and faster than all other countries who have been reporting confirmed cases. This shows an impressive and significant lab capacity. The nation offers a unique opportunity for countries that are dealing with the new coronavirus.
In this post, I use publicly available data from the Official information of Coronavirus disease 2019 in South Korea, whose repository is located here. You can find the entire notebook at this link.
Importing the data
The database contains about 7513 people having caught the disease, whose states are released, isolated or deceased. What’s really interesting about this dataset is that a great quantity of cases has informations of age and gender. After discarding patients without age or gender, the resulting dataset still has about 710 people.
Let’s take a quick look at the first rows of the outcoming dataset.
| id | sex | birth_year | country | region | infection_reason | infection_order | infected_by | contact_number | confirmed_date | released_date | deceased_date | state | age |
|---|---|---|---|---|---|---|---|---|---|---|---|---|---|
| 1 | female | 1984.0 | China | filtered at airport | visit to Wuhan | 1.0 | NaN | 45.0 | 2020-01-20 | 2020-02-06 | NaN | released | 36.0 |
| 2 | male | 1964.0 | Korea | filtered at airport | visit to Wuhan | 1.0 | NaN | 75.0 | 2020-01-24 | 2020-02-05 | NaN | released | 56.0 |
| 3 | male | 1966.0 | Korea | capital area | visit to Wuhan | 1.0 | NaN | 16.0 | 2020-01-26 | 2020-02-12 | NaN | released | 54.0 |
| 4 | male | 1964.0 | Korea | capital area | visit to Wuhan | 1.0 | NaN | 95.0 | 2020-01-27 | 2020-02-09 | NaN | released | 56.0 |
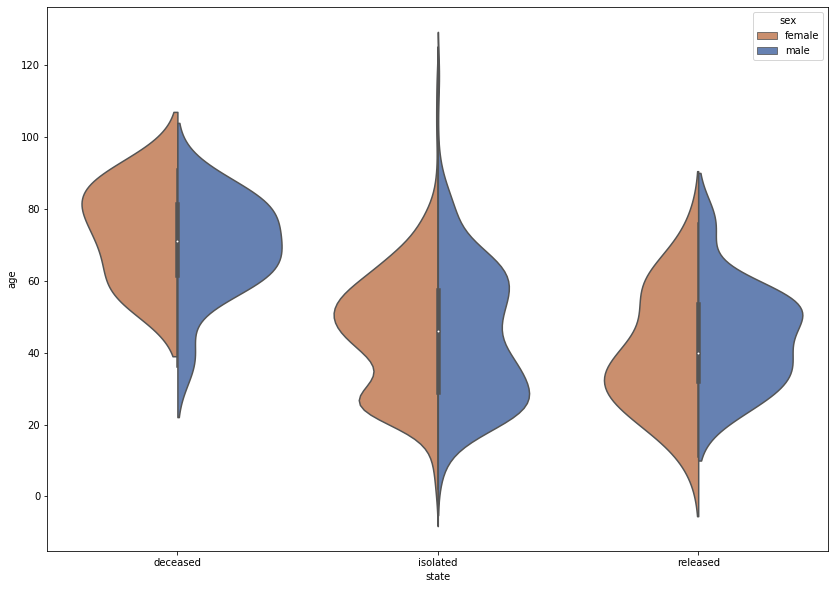
Age distribution of cases by gender
In this section we observe the distribution of confirmed cases by sex and by state: deceased, isolated and released.
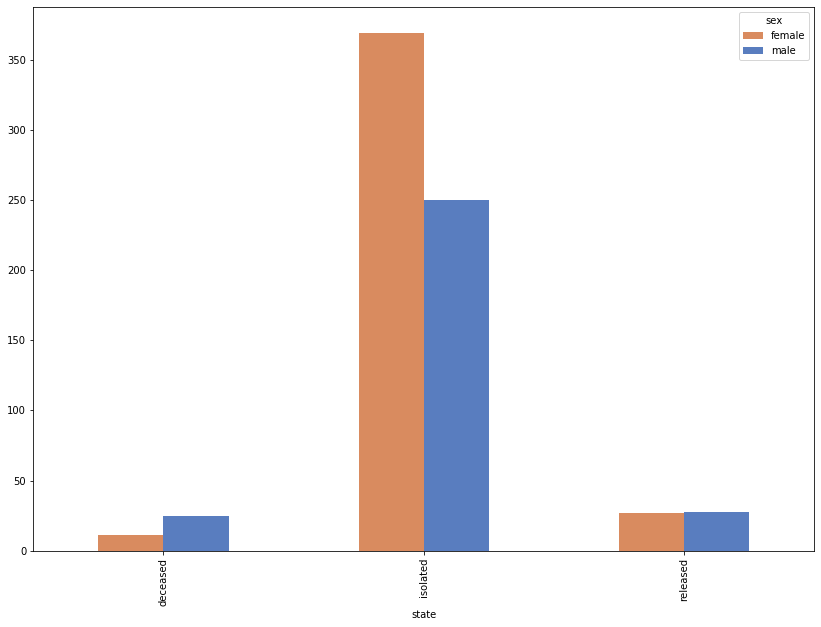
 To get a better perspective, the following barplot shows the corresponding number of cases for each category.
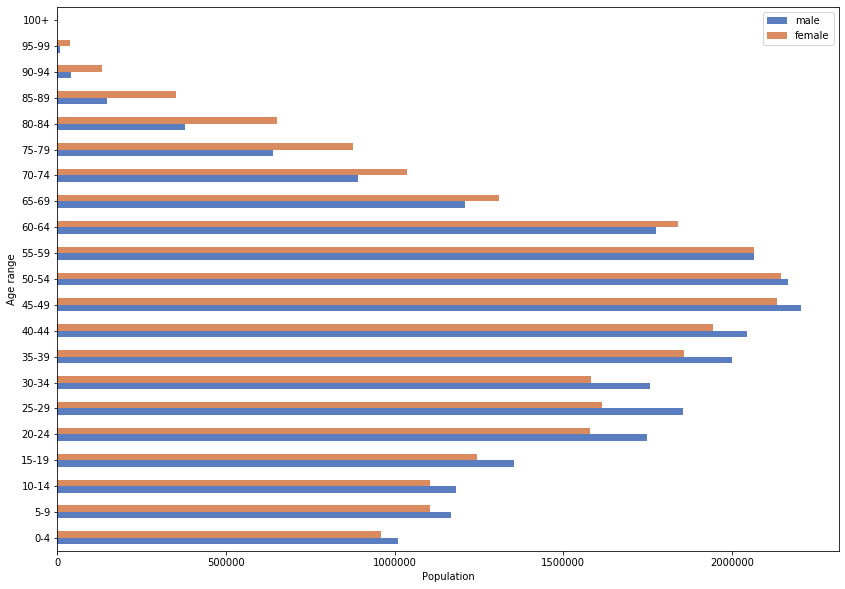
Age pyramid of Republic of Korea
To generalize the previous observation to other countries, one could balanced the age distribution by the pyramid of age. For information purpose, here is a representation of the age pyramid in South Korea.
Proportion of Covid-19 cases by gender and by age, normalized by the age pyramid
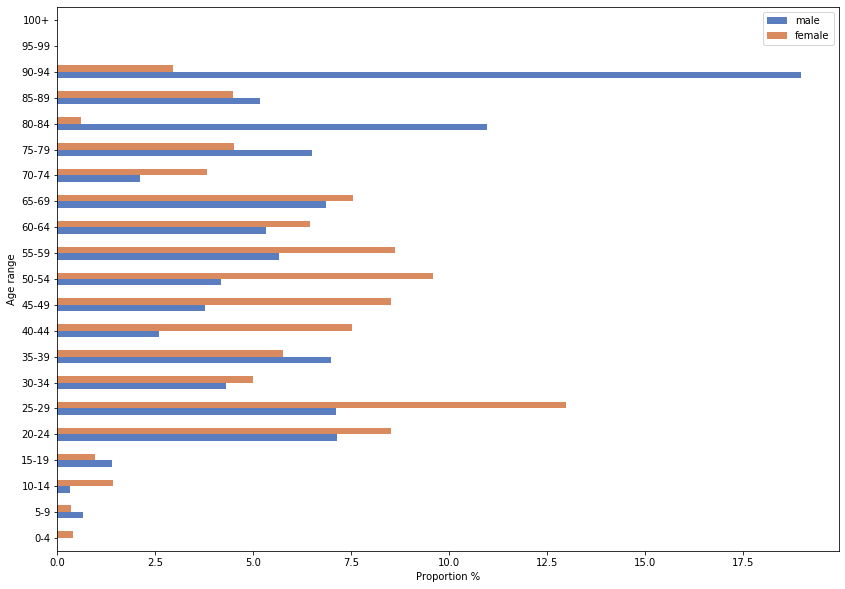
For all cases (“released”, “isolated” and “deceased”), here is the age distribution normalized/balanced by the previous age pyramid.
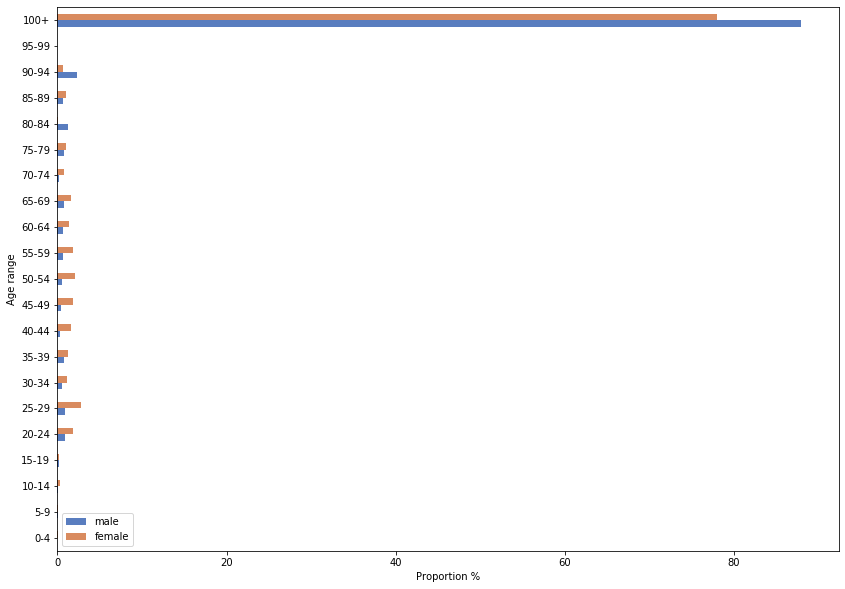 If the virus had spread uniformaly across the population, this distribution should be quite flat. However it doesn’t seem to be the case. We have a huge proportion of very old people having caught the virus ! Let’s zoom in the data to see how many centenaries are taken a census in South Korea:
| Age range | male (count) | female (count) | male (%) | female (%) |
|---|---|---|---|---|
| 100+ | 517 | 3350 | 0.002% | 0.0131% |
And how many of them had contracted the virus:
| patient_id | sex | birth_year | state | age | age_range |
|---|---|---|---|---|---|
| 5661 | female | 1905 | isolated | 115 | 100+ |
| 6070 | male | 1903 | isolated | 117 | 100+ |
| 6845 | female | 1913 | isolated | 107 | 100+ |
| 7219 | female | 1920 | isolated | 100 | 100+ |
Apparently how have a guiness record here ! Well, more seriously, South Korea has “one of the highest rated universal healthcare systems in the world, which includes care programmes for the elderly” which could explain why 0.5 percent of our dataset are centenaries. On the top that, Koreans have a specific custom considering age. Tradionnally, “babies are considered a year old on the day they’re born”. So, for a matter of visualization, we discard this age range for the further visualizations.
 Despite the high rate of tested people, the distribution of population infected seems to be quiet heterogeneous among age ranges.
Let’s take a closer look at the distribution for each case.
Despite the high rate of tested people, the distribution of population infected seems to be quiet heterogeneous among age ranges.
Let’s take a closer look at the distribution for each case.
Balanced distribution of deceased cases
![]() The following chart does NOT represent the death rate by age range. Instead, the following chart gives the proportion of deceased by age range over all the deceased states.
The following chart does NOT represent the death rate by age range. Instead, the following chart gives the proportion of deceased by age range over all the deceased states.
For a total of 36 deceased cases:
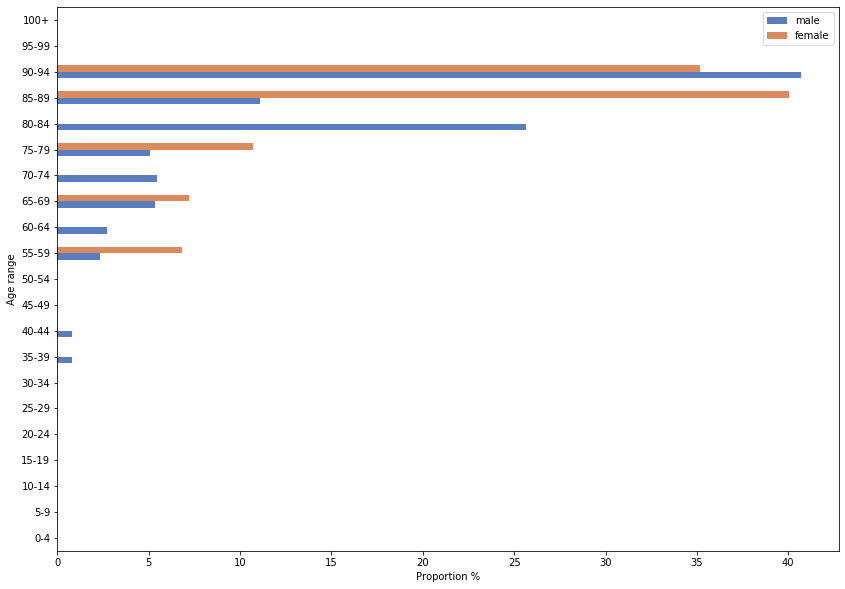
For instance, for males, 40% (balanced) who passed are in the 90-94 age range. Fortunately, deceased cases are not to high, and that does not give much weight to this analysis.
Balanced distribution of isolated cases (without centenaries)
For a total of 615 isolated cases:
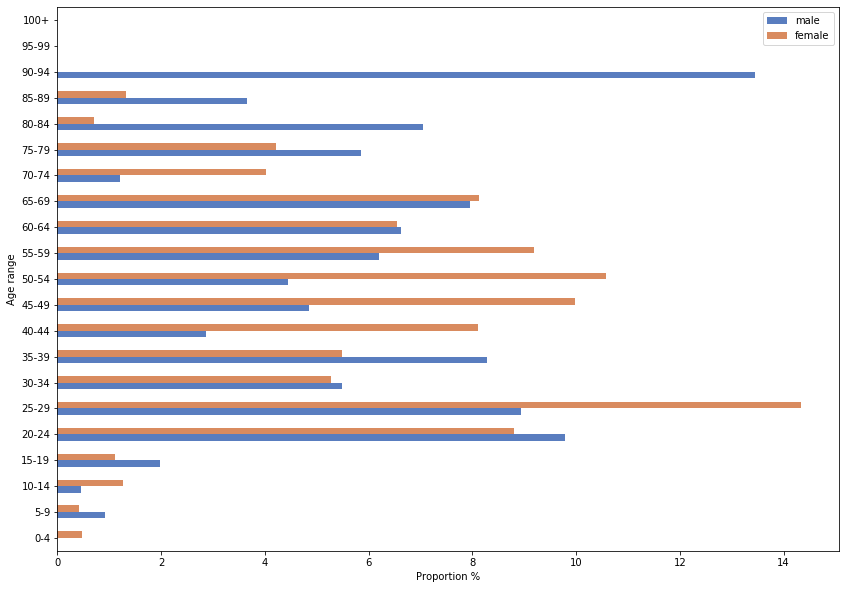 We can see that only few persons in the age range 0-19, male or female, have been contaminated.
Balanced distribution of released cases
For a total of 55 released cases:
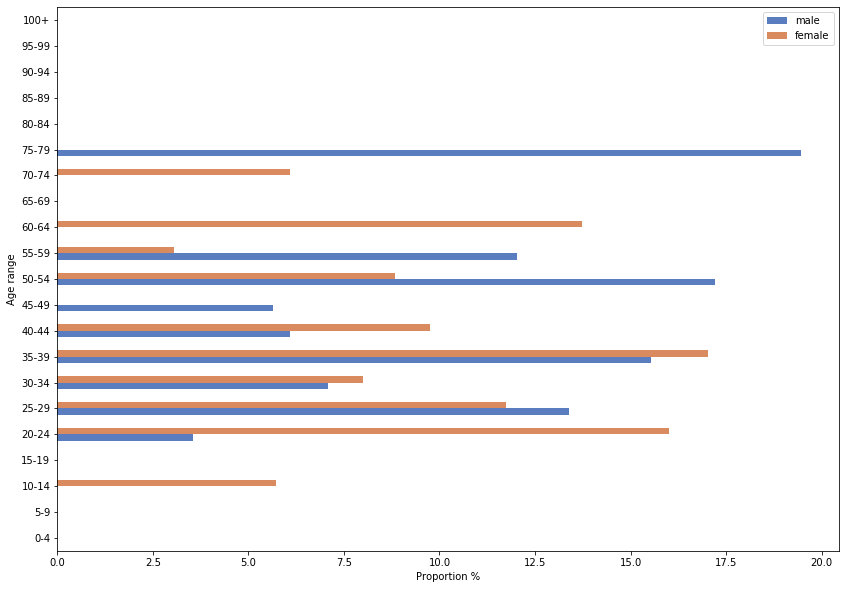 Unfortunately, number of released cases are too little at the moment, which makes it hard to draw conclusions.
Related posts
Sources
- Coronavirus outbreak in South Korea
- Testing program in South Korea
- Intro has been written with the help of gpt-2